Population of Iceland
Population: 320,137 people
Density: 3.17 people per square km
Net Migration Rate: .53 migrants/1,000 population
Birth Rate: 13.23 births/1,000 population
Death Rate: 7.02 deaths/1,000 population
Population Growth Rate: .674%
IMR: 3.18 deaths/1,000 live births
TFR: 1.89 children born per woman
% of Population < 15: 19.8%
% of Population > 65: 13.2%
Life Expectancy: 81.11 years
GNI PPP per capita in U.S. dollars: $32,840
Population living below US $2 per day: No Data
Mobile Phone Subscribers: 109 per 100 people
Motor Vehicles: 724 per 1000 people
Undernourished Population: less than 2.5%
Underweight children age 5 and under: No Data
HIV/AIDS among people 15-49: .3%
Population Trends
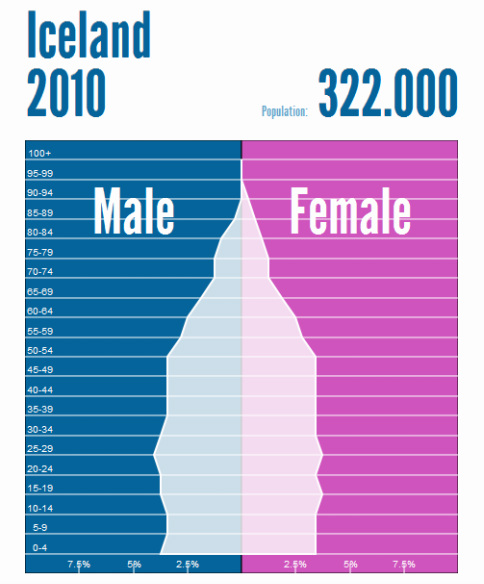
Over the years, the population pyramids of Iceland have evened out more and more. In the 1950s and 60s, the percent of the population that was between 0 and 14 was much higher than it was in later years and now, also the percent of the population over age 75 increased dramatically between 1980 and 1990. Over the next 60 years, the population pyramids will even out until they appear to be almost completely straight columns with an equal number of the population in each age group.
Historical Explanation
Iceland became an independent country in 1944. This fact could contribute to the fact that so many babies were born in the 50s. After their independence, people in Iceland may have felt they were able to have more children without worrying as much about their future because they knew their country was free now. Over time, Iceland has progressed as a modern country in our world, and so they have been able to better educate everyone, women included. Because of this, more women have gotten jobs in Iceland and are less likely to have as many babies, making the number of children and teenagers in the Icelandic population shrink from what it was in the 1950s.
Population Pyramid 1995

Population Pyramid 2010
Population Pyramid 2025

Population Pyramid 2050

Demographic Transition Model

Iceland is a country that appears to be in late stage 3. The birth rate has dropped recently from what it used to be, and the birth and death rates have almost entirely evened out. The GNI PPP of Iceland is much higher than the world average meaning it is in a late stage of development. The infant mortality rate is much lower than the average in the world, and a rate that would only be found in a well developed country. The percent of mobile phone subscribers and automobile owners in Iceland is also very high, a characteristic of a late third stage and fourth stage country.
